Open data translates into business insight
Written by Jason on October 10, 2013UPDATED October 15, 2013
Inspired by GTEC 2013's Open Data session yesterday, we've got a three dataset mashup to share with you.
We'll overlay the number of private aircraft registered in Canada by the first three letters of the regitrant's postal code.
For data sources, we used Transport Canada's Civil Aircraft Registry, Statistics Canada's 2011 census population data and Canada Post's Forward Sorting Area boundaries (via StatCan).
The underlying data is a few megabytes, so rather than embedding the interactive visualization directly on this page, please click on the image below to launch it in a new window.
The regional colouring on the map is determined by the number of aircraft per population -- the redder the region, the higher the concentration. Clicking on a region brings up additional detail, including market shares for the top five manufacturers in Canada.
This is just one example of how open data can help businesses - an aircraft manufacturer or dealer could use this as a tool to help them look for potential new markets.
Keep reading to learn how we implemented this, as well as some of the hiccups we encountered.
Keep reading...Tags: examples
Capturing and validating data, part 2
Written by Jason on August 20, 2013This is the second post that discusses various ways to validate your imported data. In part 1, we discussed how content check fields help ensure a source file hasn't been changed or corrupted, and how pattern matching lets you discard elements that don't meet a predefined pattern.
In this part, we'll cover data extraction, which allows you to validate and capture a subset of an element, e.g., the last word of a title on a web page.
We'll also look at data approval, which lets a dataset's owner approve or reject changes from other write-authorized users or automated imports before being applied to the dataset. This functionality can be used as part of a formal data submission/approval process or simply be used to put an extra set of human eyes on a critical dataset.
Let's start with data extraction. Basically, you'll select an individual element (in cell capture mode) or a column (in table capture mode) and use a regular expression to extract a portion of those contents and verify them.
Keep reading...Tags: examples, features, imports
More map improvements - display and interact the way you want
Written by Jason on July 11, 2013We're very pleased to announce custom KML plotting on maps in our interactive dashboards. Users can now define their own lines, points and polygons in a report, plot them on a map, and add controls to let other users navigate through the details.
Here's a quick example of it in action - the interactive lines below represent the top 100 US air travel city pairs in Q4'12. The line width is proportional to passenger counts and the color varies by yield (green is low yield, orange is high).
This dashboard was created using the Q4'12 US consumer airfare report data.
Keep reading to learn how to create your own custom KML charts.
Keep reading...Ensuring the integrity of your automatically captured data
Written by Jason on July 2, 2013When our users look to automate their Internet data capture needs, a common question is how can they ensure a dataset's integrity. After all, when you're importing data manually, you see what's being captured. Say a web server responded with an error page, it's obvious to a person that there's a problem. To a computer? Perhaps not.
We know that situations like this are a major concern (perhaps THE major concern) for many of you. We offer a number of easy ways to ensure that the data being captured is actually what you intended to be captured. These methods include:
- Content checking - confirm that specific cells match what you saw when you set up the capture
- Pattern matching - ensure that the contents of a cell conform to a user-created pattern
- Data extraction - isolate a targeted portion of an element with regular expressions. No match, no capture.
- Owner approval - review and accept all changes to a dataset before being stored
Let's look at the first item in the list - content checking. This helps you verify that the source contents are complete and well-formed by looking at specific elements in the document. You can select one or more elements in the source data, and for subsequent automated imports, the contents of those elements must match the contents when the data was first imported by you; if they don't, the document is considered invalid.
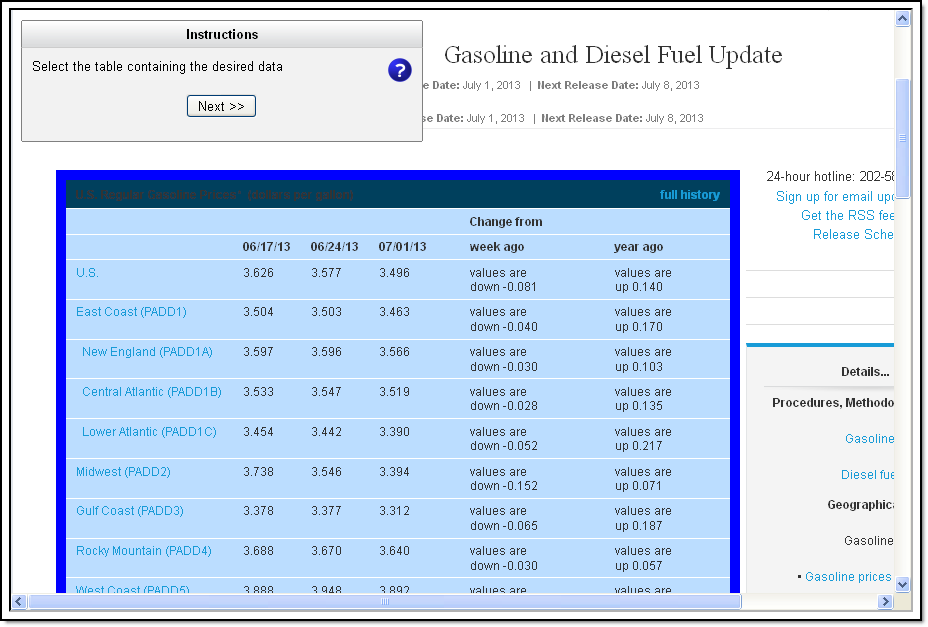
We can show you how easy this is to do using sample data from the US Energy Information Administration (EIA). We'll use a weekly gas price table on their website at http://www.eia.gov/petroleum/gasdiesel/ for the demo.

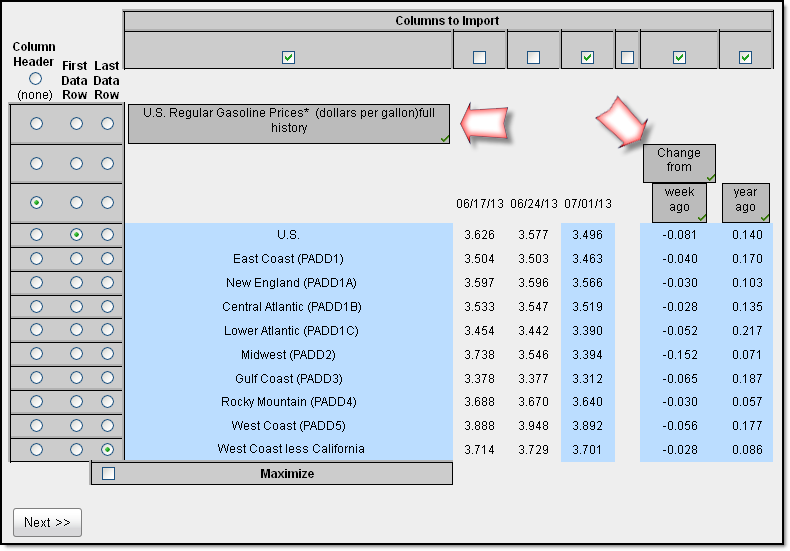
The gray boxes seen below indicate content checks, and the content within them must be present every time the source data is retrieved. If the content is missing or has changed, the page will not be captured, and if it doesn't appear after a number of retries, you'll be alerted to the situation. This helps you ensure that your source data isn't corrupted (e.g., page not properly loaded) as well as confirm that the source layout hasn't changed (e.g., columns removed or rearranged).

To add a content check in a table-style capture as in our example, click on any cell as you would to capture the data. If you're capturing individual cells as opposed to an entire table, to make the selection a content check, click on the check mark in the box. The usual light blue capture box will change to a grey content check box.
You'll see a summary of your content check cells in subsequent steps.

Content checks are available for all of the Internet-retrieved data sources (including spreadsheets, web pages, XML, and more) in both cell and table capture modes.
Up next, pattern matching.
Keep reading...Tags: examples, features, imports
Interactive dashboards have arrived
Written by Jason on June 10, 2013You might already have seen some of the interactive dashboard previews we've put out. Today, we're pleased to officially roll out this capability to our users.
You can now create user-driven dashboards such as the one below (it plots sequential changes in US durable goods orders vs copper prices -- used as a proxy for raw inputs). In this example, anyone using the dashboard can explore the data and control the years and months shown on the chart independently (to examine seasonal trends), as well as the actual copper price. The table beneath summarizes the selected data by year.
Not only is this functionality extremely useful, it's quick to implement as well. It took us less than two minutes to add the controls and summary table.
You can add these controls and summaries to the standard charts (e.g., line, column, area, combo) as well as maps. We support the following control types: number ranges, date ranges, category selectors, and text searches.
Controls apply to one chart at a time, so users can interact with multiple charts independently on a single dashboard. The available options will automatically appear in your dashboard editor on a chart-by-chart basis.

As always, we're happy to answer any questions you have.
Tags: features


